The futures got a nice boost Friday morning from a series of positive developments that included a drop in oil prices below $90 per barrel, a report that a bailout plan is in the works for subprime borrowers, and a tacit signal from Federal Reserve Chairman Ben Bernanke that interest rates will likely be cut again at the December 11 FOMC meeting. The Government it seems is likely to step in and support the dollar (just my thinking), so the Fed can cut fifty to bail out the Banks.
(See charts) Technically the market averages were up substantially over the previous three days with a gap higher start on the fourth day to resistance near 1490 S&P 500 (Oct low/early Nov breakdown point, Mid-Nov reaction high, 50% retrenchment of Oct-Nov decline), 2698/2701 Nasdaq Comp (same resistance as S&P 500) and 13346/13460 (early Nov low/breakdown point, 50% retrace) providing an opportunity to book at least some profit, we could get a couple of down days Monday and Tuesday before the buyers come in unless there is some more good news. Top performers on the day outside of Finance/Housing included Transports, Paper, Tobacco, Retail, Medical Supplies and Media. Weakness today came from Computer-Hardware, Mining, and Gold/Silver.
In a nutshell, we are up big on the week with housing and financials as the front-runners, which is fitting since this all started with them so they should bottom first. The market doesn’t bottom all at once, so if you look at the different sectors the Nasdaq was hanging in while the S&P and Dow were getting hammered, until it dropped a hundred points in a two day period. So I expect that to be a laggard.


Friday, November 30, 2007
Stock Market Recap for 11/30/07
Oil Services ETF

The oil service stocks have been hammered lately, and OIH (OSX ETF) recently hit 203/share is down almost in the straight line from there almost thirty bucks. The oil services basket is trying to stabilize around the 171 level, Oil prices are down from a 100, 12 bucks in a week. The oil service stocks usually go up before Crude. We are in seasonally the best time to buy oil service stocks with the winter freeze upon us, the only conflicting thing i see here is that the $BPENER, bullish percent energy index doesn't appear as oversold as I would wish and that fact is keeping me from going all in to this trade. Time to start nibbling.
Financial Sector ETF

On of my favorite indicators for the markets is the $BPFINA, when its >30 level its time to buy the XLF, this time I was too early as we went all the way to 16.13 and its not too late to catch this move, they are extremely oversold still and we wont go straight up so I have been nibbling since the day the character of the markets changed the best friends of the at this time are the Financials. Check out the chart it will tell you when to exit, usually at or above 80. You can see on the weekly chart takes time to unwind so I try to sell in increments as it can stay overbought for weeks.
Prudent Stock:11/30/07

(JCI) Johnson Controls, Inc. is an interior experience, building efficiency, and power solutions company. It operates in three segments: Building Efficiency, Automotive Experience, and Power Solutions. Building Efficiency segment engages in the design, production, and installation of control systems that monitor, automate, and integrate building operating equipment and conditions. The stock is down significantly from a 52-week high but has held up well at the 200 day moving average, I may be a little late but there is still room in this move. It reported a good quarter and has been a steady and consist stock for many years. The company recently forecasted earnings growth 17%, sales growth of 11%, and has a PE of 13. The stocks fair value is around 60/share.
Thursday, November 29, 2007
A Change in Character for the Market

Tuesday we sold off mid-day and finished strong that was a tell. I noted that the correction is over, but we won't go straight up but i do think we rally until year end. I will be buying the DXD until 46 level, (Ultrashort DOW, goes up when DOW goes down) as it gets weaker to have insurance in the portfolio for the downside. We had bleak economic news yesterday, Oil prices saw a biggest one-day drop in dollar terms, but comments from the Fed vice Chairman spurred the markets to a huge and impressive gain. The technicals of the market are improving, the supports have held very strongly (see chart) However the fundamentals are weak, subprime and housing weakness haven’t gotten better but remember the market in forward looking and is expecting rate cuts, Fed is back on the side of the equity markets, and the fund managers have to buy the stocks that have done the best so they can show their boards that they didn’t miss the boat on the good stories of the year. So buy the weakness will work when adding to positions at this time with a short leash, this is no time to roll the dice.
See disclosure
Prudent Stock: 11/29/07

(MTW) The Manitowoc Company, Inc. engages in the manufacture and marketing of cranes and related products, foodservice equipment, and marine products in the United States and internationally. It operates through three segments: Cranes and Related Products (Cranes), Foodservice Equipment (Foodservice), and Marine. The Cranes segment designs, manufactures, and distributes crawler and truck mounted lattice-boom cranes, top slewing and self erecting tower cranes, mobile telescopic cranes, and hydraulically powered telescopic and articulated boom trucks under Manitowoc, Potain, Grove, and National brand names. This segment provides crane product parts and services, and crane rebuilding and remanufacturing services under the Crane CARE brand name. Its products are used in various applications, including energy, petrochemical, and industrial projects; infrastructure development; commercial and high-rise residential construction; and mining and dredging. The Foodservice segment designs, manufactures, and markets commercial ice-cube and flaker machines and storage bins; refrigerators and freezers; refrigerated under counter and food preparation tables; ice/beverage dispensers; post-mix beverage dispensing valves; cast aluminum cold plates; carbonator tanks; long-draw beer dispensing systems; compressor racks and modular refrigeration systems; pumps; valves; and backroom beverage equipment. It offers its products under Manitowoc, SerVend, Multiplex, Kolpak, Harford-Duracool, McCall, McCann’s, Koolaire, Flomatic, Kyees, and RDI brand names. The Marine segment operates three shipyards in Marinette and Sturgeon Bay, Wisconsin; and Cleveland, Ohio. It designs and constructs military and commercial vessels, double-hulled tank vessels, articulated tug and barge units, dredges, dredging support equipment, and bulk cargo self unloading solutions, as well as engages in large ship construction projects and repair work.
MTW has shown a consistent and predictable history of financial performance. Its current EPS is $3.06 per share, and has a forecasted earnings growth rate of 25.00%, and a current PE of 13.73.
Given the companies forecasted earnings per share, forecasted earnings growth, profitability, given current interest, and inflation rates it should be fairly valued at a range of $73-78 per share. If you look at the chart the stock it has found real support at the 200 day moving average. In my opinion the stock was unfairly sold of after earnings due to domestic weakness and fears that the rest of the world would slow due to a US recession. I think all that is reflected by the sell off in the stock in recent days. I opened a position yesterday at the open and will add on any weakness.
See disclosure
Tuesday, November 27, 2007
Prudent Stock: 11/28/07

(MTL) Mechel , an open joint stock company, through its subsidiaries, operates as a mining and steel company. The company engages in the production and sale of coking and steam coal concentrate, steam coal, iron ore concentrate, and ferronickel that are used in the production of steel. It also produces semi-finished steel products; carbon and specialty long products; carbon and stainless flat products; value-added downstream metal products, including hardware, forgings, and stampings; and coke and coking products. As of January 1, 2007, the company had proven and probable reserves of approximately 281.8 million tones of coal; 61.4 million tones of iron; 13.0 million tones of nickel ore; and 23.9 million tones of limestone. It operates in Russia, other Common Wealth of Independent States, Europe, Asia, and the Middle East. The company is headquartered in Moscow, Russia.
MTL not to be confused with MT (Mittal Steel also a great steel stock) has shown a consistent and predictable history of financial performance. Its current EPS is $7.54, and has a forecasted earnings growth rate of 30.00%, and a current PE of 9.93.
Given the companies forecasted earnings per share, forecasted earnings growth, profitability, given current interest, and inflation rates it should be fairly valued at a range of $130-135 per share. If you look at the chart the stock as hung in real well during the sell-off. The chart has some real strength supported by excellent fundamentals and is undervalued.
see disclosure
Stock Market Recap: 11/27/07

Market futures opened up strong on the back of Citigroup news, followed by a decline in the futures by two thirds. Then we had a progressively bullish start. Stock prices retreated as the confidence number hit the wires, but they shook off the headline disappointment knowing that (a) the decline wasn't really that surprising given the negative headlines of late economic data,(b) Thanksgiving sales reports exposed the weak link between confidence and actual spending activity and oil dropped 3.5%.
Later in the day the market was weakened by bearish comments by the Philadelphia Fed (Plosser). Market gave up nearly half of its gains on the back of that commentary. However, all said and done, there is finally a technical light at the end of the tunnel. The bullish sign I see here is that the rally gained strength at the close and did not fade. When the DOW crashed through support yesterday and quickly regained the 12900 (INDU) mark. I am now calling an end to the correction phase, we won't go straight up though. If you start plotting your trend line from yesterdays lows I believe we will be much higher in the next two to three weeks. But thats not what I do, I am not a prognosticator so I have to position my self for the probability scenario. I still am 20% short and 50%long at this time. On days there is selling I will lighten up on short and add to my long positions.
Prudent Stock: 11/27/07

(NOV) National Oilwell Varco, Inc. engages in the design, construction, manufacture, and sale of systems, components, and products to the oil and gas industry worldwide. It operates in three segments: Rig Technology, Petroleum Services & Supplies, and Distribution Services. The Rig Technology segment produces and sells systems for the drilling, completion, and servicing of oil and gas wells. It provides equipment that automates well construction and management operations, such as offshore and onshore drilling rigs; derricks; pipe lifting, racking, rotating, and assembly systems; coiled tubing equipment and pressure pumping units; well workover rigs; wireline winches; and cranes. The Petroleum Services & Supplies segment offers various consumable goods and services used to drill, complete, remediate, and workover oil and gas wells and service pipelines, flowlines, and other oilfield tubular goods. Its products include transfer pumps, solids control systems, drilling motors and other downhole tools, rig instrumentation systems, and mud pump consumables. This segment also provides oilfield tubular services, including the provision of inspection and internal coating services, and equipment for drillpipe, linepipe, tubing, casing, and pipelines; and engages in the design, manufacture, and sale of coiled tubing pipes and composite pipes for applications in corrosive environments. The Distribution Services segment offers maintenance, support, repair, and operating supplies; and spare parts to drill site and production locations. National Oilwell Varco serves drilling contractors, shipyards and other rig fabricators, well servicing companies, national oil companies, independent oil and gas companies, supply stores, and pipe-running service providers. The company is based in Houston, Texas.
NOV has shown a consistent and predictable history of financial performance. Its current EPS is $4.58, and has a forecasted earnings growth rate of 25%, and a current PE of 15.
Given the companies forecasted earnings per share, forecasted earnings growth, profitability, given current interest, and inflation rates it should be fairly valued at a range of $123-128 per share. Recently the stock was hammered due to growth rate concerns, slowing economy or possible recession, it’s been hanging in well the last 4-5 trading sessions. Stock made a bottom around $61 and seeing as how its fair value is over a 120 it looks like a good buy.
Investment in Citigroup spurs futures
The futures are sharply higher this morning (although, off there highs). Due to several factors: The Abu Dhabi Investment Authority will invest $7.5 billion in Citigroup, offering the nation's largest bank needed capital to offset big losses from mortgages and other investments. British bank Barclays said Tuesday that it expects earnings for the year to broadly match market expectations as growth in retail and commercial banking has helped it cope with the turbulent credit markets. On Monday, Pulte Homes (PHM) reaffirmed its fourth-quarter quarter pre-impairment earnings and cash position outlook, despite a weak housing market. I guess people think there is real value in the US financials. In any case, I have not trusted any of the recent rallies and have not been buying into them, but I am opening small positions in sell offs. I still believe we go to 12500 (INDU) before it’s all said and done.
Sunday, November 25, 2007
Stock of the Day 11/26/07
 (BVN) Compania de Minas Buenaventura S.A.A. engages in the exploration, mining, and processing of gold, silver, and various metals in Peru and internationally. It primarily produces refined gold, and various metal concentrates, including silver-lead concentrate, silver-gold concentrate, zinc concentrate, and lead-gold-copper concentrate. The company operates six mines and holds controlling interests in two mining companies; BVN also owns an electric power transmission company; an engineering services consulting company; and interests in various mining companies. It sells its metal concentrates to smelters, traders, and banks principally in Peru, Europe, North America, Asia, Oceania, and South America.
Investment Environment:
- Earnings and inflation are rising, while interest rates are falling or on hold.
- New housing starts rose by an unexpected 3% in October to an annualized 1.229 million.
- Single-family starts dropped for the 7th consecutive month in October by 7.3% for an 884,000 rate, a 16-year low.
- Building permits, a gauge of future demand, also fell in October by 6.6%, a 14-year low.
- The National Association of Home Builder's Optimism Index remained at 19 for the second straight month in November and the lowest reading on the Index since its inception in 1985.
- Large declines in housing permits, initial claims for unemployment insurance and the Index of Consumer Expectations pushed the Leading Index 0.5% lower in October, a 2-year low.
- Jobless claims fell by 11,000 to 330,000 in the week ended November 17th.
- Crude oil topped $99 per barrel last week
- U.S. crude supplies fell for the 2nd week.
All the indicators I follow (see philosophy) at or near where the stock market bottomed in August, I just haven’t seen capitulation in the VIX, an intra-day spike with a powerful reversal would be perfect to call a bottom. Although we may not get a perfect situation its not unreasonable to have a list of stocks to buy and start entering them piecemeal in the next couple of days. There still may be some room to move to the downside but damage should be limited.
Investment Method and Philosophy
My investment philosophy is to buy stocks long when the market conditions are right. So what does that mean? The market goes up and down every day but if you connect the dots you see the market prices make higher highs and higher lows which points to an upward trend, or the market can make lower highs and lower lows or a downward trend. Or the market can go side ways or be in a consolidation phase. Best time to buy stocks is when the up ward trend is intact. I use several indicators that have not failed me yet to determine bottoms and tops but the most reliable one is $BPCOMPQ, NASDAQ bullish percent index (See previous posts). I also use the Volatility Index (VIX) and the number of new 52-week highs and new 52-week lows and trend lines, which I will discuss sometimes on a daily basis. With regard to picking stocks my philosophy to find stocks that have been knocked down without any real bad news or fundamental change to their outlook or their business. These stocks have a habit of reporting consistent earnings growth in the past 8-12 quarters, so they have strong management, they are undervalued with respect to their projected earnings growth and there is some theme or story about the stock, which is intact. Finally, when to sell or take some profits. Stocks don’t just go up and up forever; they usually trade between upper and lower trend lines, some stock however do go up almost in a vertical fashion but that may last a few days, they usually revert to their trend or crash. How I buy and sell, First I make certain the Market is buyable, then I establish that a stock meets my criteria, I buy 1/3 position to open, if the stock goes down 10 percent I close the position and look for another. If the stock moves sideways or up I will buy another 1/3 and buy the final 1/3 up to 5% on the upside. So when to take profits. I take off 1/3 when the stock hits its upper trend line or there is a blow off day, where the stock make intra-day 52-wk high during the day and either closes down or flat or slightly up and the volume. This is a sign of a tired stock. There are times that after a few days of profit taking the stock will continue to run up, that’s why its good to not take all your position of the table. If the stock breaks down sell another 1/3, sell the final 1/3 if the stock hits its 13-week moving average. It is important to know there are many different methods to picking, buying and selling stocks. Nothing is set in stone and a lot of it is a matter of practice and finding a way that you are comfortable with. One thing is for sure don't fall in love with your winners, cause that’s when they become your biggest losers. Stocks are just pieces of paper don't fall in love with them.
Friday, November 23, 2007
Weekly Market Chart Wrap 11/23/07
 (Chart of the NAZ from 8/06 - 11/23/07 ) shows it has given up about 66% of the move from August low to it's late October high . The bounce in the Indices today comes after a day where there was not one sector in the green, a rarity. NAZ bouncing right at the 200day moving average, only significant only if there is a follow through the next trading day, otherwise a one day wonder. A break above 2700 would mark the end of the correction. The path to least resistance is still definitely to the downside so this is no time to make big bets and keep everything on a tight leash. I am protecting my capital.

S&P 500 is also below its 200 day moving average and is barely hanging on to its long term trend line. It's August low is the next support level which is 1370.
Next week will be crucial for the markets as we are right at a breaking point. I would have loved to have seen a crash straight down to August support levels to get the weak holders out of the market. In my opinion this rally simply prolongs the pain that is surely to follow, unless we get some emergency ease by the Fed on Monday.
Have a good weekend.
Stock of the Day 11/23/07

Vimple has a forecasted EPS of $1.71 per share, which would give it an estimated Earnings Growth Rate of 29.00% vs a PE ratio of 18 so the stock is very cheap. Stock has held up very well during the decline and was actually up on some of the really bad days. Stock has value til a price of $49.95 per share. Best part of this story is the rest of the world is growing a lot faster than the US and from a very low base and thats where VIP sells. I do not own this stock but its a part of one of my mutual funds. and i looking to go long but i am looking to open a position.
Please note that the subject matter provided on all of the posts on this site is for information purposes only and should not be construed as a recommendation to buy or sell stocks or funds by the author. Investors who do so should do their own due diligence and or consult their financial advisor and are responsible for their own financial decisions.
Most Undervalued Stocks: Wk 11/19/07
Symbol | Price | $ Change | %PRC | PE | Growth | AvgVol | Mkt Cap($M) | Sector |
PTR | 181.00 | -9.60 | -5.04 | 14 | 28 | 1685100 | 324028.00 | Petroleum |
GES | 40.48 | -0.03 | -0.07 | 11 | 28 | 1725200 | 3809.57 | Apparel |
SHI | 56.52 | -4.16 | -6.86 | 6 | 30 | 100900 | 4069.44 | Chemical |
TNH | 100.91 | -4.29 | -4.08 | 10 | 26 | 312100 | 1886.01 | Chemical |
BHP | 69.85 | -2.86 | -3.93 | 11 | 26 | 5381700 | 197683.20 | Mining |
CCJ | 39.86 | -1.89 | -4.53 | 15 | 29 | 3232900 | 13836.20 | Mining |
FCX | 90.06 | -1.79 | -1.95 | 8 | 26 | 11449800 | 34395.72 | Mining |
PCR | 49.67 | -2.96 | -5.62 | 13 | 28 | 520000 | 1340.10 | Building |
TKG | 95.25 | -2.16 | -2.22 | 5 | 29 | 5700 | 12397.74 | Utility |
MSCC | 22.59 | +0.25 | +1.12 | 18 | 30 | 1213700 | 1731.07 | Electronic |
PCU | 100.20 | -5.79 | -5.46 | 10 | 19 | 2176400 | 29505.89 | Mining |
VIP | 31.05 | -0.45 | -1.43 | 18 | 29 | 3146400 | 31594.62 | Telecomm |
EXM | 39.30 | -1.94 | -4.70 | 6 | 29 | 1517000 | 784.04 | Transportation |
GENZ | 71.74 | -0.96 | -1.32 | 19 | 30 | 2848900 | 19081.41 | Drug |
MDR | 46.93 | -2.15 | -4.38 | 16 | 27 | 2338600 | 10567.23 | Petroleum |
MTW | 38.33 | -0.66 | -1.69 | 12 | 25 | 2094600 | 4814.25 | Diversified Companies |
Please note that the subject matter provided on all of the posts on this site is for information purposes only and should not be construed as a recommendation to buy or sell stocks or funds by the author. Investors who do so should do their own due diligence and or consult their financial advisor and are responsible for their own financial decisions.
$BPCOMP

Extremely Oversold
Bear-ly Hangin" In dustrials
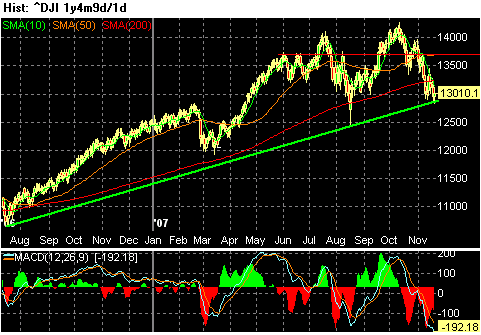
Dow Graph: 11/20/07