11/21/07
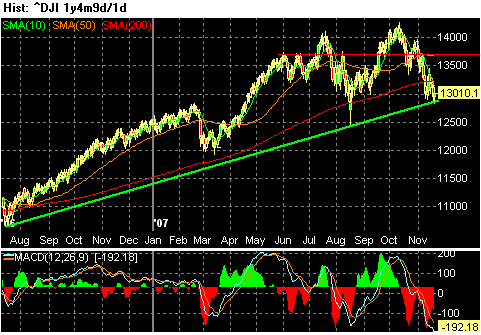
One of the other ways I like to look for tops and bottoms so I can trim and add positions as needed is a very useful indicator known as the Nasdaq Composite Bullish Percent Index. If you go to http://www.stockcharts.com/, a very useful site, from which I get no compensation. Type in $BPCOMPQ and you will see a chart of an index that is trying to find a bottom. Last August the market bottomed at 32.5, we are almost there. You can see a longer term view of the chart and you'll see below 35 or so market tries to start finding its way up. For the tops you can start to take profits when the RSI gets above 70, so i usually take off 25% off the table, because with being oversold and overbought it can last a while, and you can let your profits run. Then what I do is look at the new 52 week highs list and as that starts to get lower in number, at that point the rally phase may be losing steam, then I close out another 25% of my positions. I have been using this method with a great deal of success.


No comments:
Post a Comment