2008 is finally here and after taking a break for the holidays its time to get back to work. Boy we are off to a miserable start and there is a lot of gloomy chatter out there. One thing I am looking at in this environment is what I’ll call the difference between the mood on the Street and the Charts. There is non-stop subprime issues and the recession talk on CNBC, it feels as if the view on the Street is that we are just one bad day away from outright financial Armageddon. However, a longer-term chart of the S&P 500 Index (SPX) shows we are still in an up trend. In fact, a rally of 6% is all we need to hit new all-time high territory. This is contrary to what happened when the internet bubble burst. At that time all I heard was that everything would be back and that we were in a correction even as The Market suffered a steady blood letting, but the mood was much cheerier than now. One of the indicators I follow indicator is the 21-day moving average of the equity-only put/call ratio. As the name suggests, this ratio looks at option activity for all optionable equities - filtering out exchange-traded fund and index options. This ratio has trended higher since mid-October and is now nearing its August peak of 0.79. This shows that people are becoming more bearish, thus increasing the chances of a tradeable bottom, very soon. Turning back to that August peak in the ratio, it coincided with the bottom of the summer sell-off and subsequent 15% rally in the SPX during the next two months. This indicator, coupled with some other sentiment indicators like BPCOMP show we are almost bottoming from this recent slide. Another thing I look at is the number of up days in a row vs. the number of down days in a row. I have noted in the past that everytime we have been down 5 days in a row, we have had a powerful rally, that lasts a few days. As of today we are down 4 days in a row, so lets see tomorrow could be a day that leads to a turn around.
In scanning these negative headlines, it’s no surprise that investors are bailing out of domestic mutual funds at record levels and portfolio insurance has nearly doubled since last year. But when I look at a long-term chart of the various stock indices, I ask myself what the fuss is all about and what will catch investors flat-footed? The market participants are aware of the risks, but the charts ultimately suggest that the troubles are contained to financials and housing. Looking elsewhere, I see many stocks making great gains on the heels of better-than-expected earnings, even amidst the gloomy headlines. I would expect these worries to carry over into 2008. While the media and retail investors worry about what might happen to the economy and sectors that have been devastated by the subprime and housing mess, I’ll continue to focus on stocks and sectors that are currently rewarding investors behind the headline news. I believe this year will be just like last year. Money will be made following world growth trends. The sectors that worked last year will work again this year.
Oil and Gas exploration
Agriculture
Metals and Mining
Aerospace and Defense
Clean Energy (solar)
Foreign Cellular Companies
Dry Bulk Shipping
Stocks I currently own VIP, TRA, FCX, PBR, PBW, KALU, HOLX, ATW, DE and HAYN
Wednesday, January 2, 2008
2008
Posted by
prudentstockinvestor M.D.
at
11:27 AM
![]()
Subscribe to:
Post Comments (Atom)
About Me: Disclaimer
$BPCOMP

Extremely Oversold
Regarding Chart: BPCOMQ
This is the lowest close seen in years, usually a sharp and violent rally follows these moves enhanced by short covering, this is no time to short and start making a shopping list.
Bear-ly Hangin" In dustrials

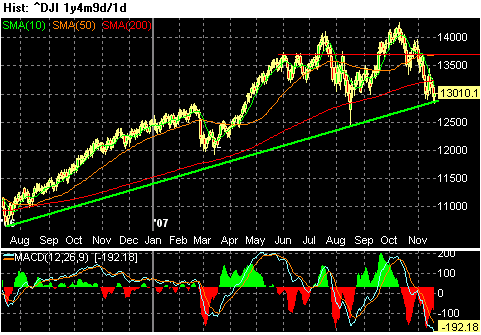
Dow Graph: 11/20/07
The Dow looks like its fighting for its life here at the level. It's no surprise there was a vicious bounce off the trend line as shown in the chart. Unfortunately, the last time we had that five hundred point reversal day was caused by the Fed stepping in, there has to be a similar event that helps the market or there is more pain ahead. The Fed minutes said nothing the market really liked, we sold off hard and bounced back hard as we hit support. This was just a reflex rally we may have to get one more really painful selloff to get around 12500.
5 comments:
I agree with your comments of what will work in 2008, however it appears that your analysis of the current 21 day MA of the CBOE Equity Put/Call ratio is a little off. The current Put/Call ratio is near the 0.79 value you mentioned, but the 21 day MA is closer to a mid-range of around 0.66 - which unfortunately is a long way from the August 07 high. I enjoy reading your posts and find them to be very much in-line with my investing style.
great analysis
Mark, first of all welcome and thanks for posting a comment. If youd like to be a contributor to the site let me know. Now what I put up was the ratio of all the optionable stocks in the data base and filtered out exchange-traded fund and index options so this may explain the discrepancy. And Mike, welcome back .
I use Schaeffers site to keep an eye on the Put/Call ratio - it has a 1 day lag, but it shows both the SPX & MA(21) of Put/Call so its easy to see the divergances. Here's the link..
http://www.schaeffersresearch.com/streetools/market_tools/cboe_eqpcr.aspx
It looks like HOLX is starting to move again. Got some MAR08 $70 calls today. Should hit $72 soon..
Thanks
Post a Comment