
2008 is finally here and after taking a break for the holidays its time to get back to work. Boy we are off to a miserable start and there is a lot of gloomy chatter out there. One thing I am looking at in this environment is what I’ll call the difference between the mood on the Street and the Charts. There is non-stop subprime issues and the recession talk on CNBC, it feels as if the view on the Street is that we are just one bad day away from outright financial Armageddon. However, a longer-term chart of the S&P 500 Index (SPX) shows we are still in an up trend. In fact, a rally of 6% is all we need to hit new all-time high territory. This is contrary to what happened when the internet bubble burst. At that time all I heard was that everything would be back and that we were in a correction even as The Market suffered a steady blood letting, but the mood was much cheerier than now. One of the indicators I follow indicator is the 21-day moving average of the equity-only put/call ratio. As the name suggests, this ratio looks at option activity for all optionable equities - filtering out exchange-traded fund and index options. This ratio has trended higher since mid-October and is now nearing its August peak of 0.79. This shows that people are becoming more bearish, thus increasing the chances of a tradeable bottom, very soon. Turning back to that August peak in the ratio, it coincided with the bottom of the summer sell-off and subsequent 15% rally in the SPX during the next two months. This indicator, coupled with some other sentiment indicators like BPCOMP show we are almost bottoming from this recent slide. Another thing I look at is the number of up days in a row vs. the number of down days in a row. I have noted in the past that everytime we have been down 5 days in a row, we have had a powerful rally, that lasts a few days. As of today we are down 4 days in a row, so lets see tomorrow could be a day that leads to a turn around.
In scanning these negative headlines, it’s no surprise that investors are bailing out of domestic mutual funds at record levels and portfolio insurance has nearly doubled since last year. But when I look at a long-term chart of the various stock indices, I ask myself what the fuss is all about and what will catch investors flat-footed? The market participants are aware of the risks, but the charts ultimately suggest that the troubles are contained to financials and housing. Looking elsewhere, I see many stocks making great gains on the heels of better-than-expected earnings, even amidst the gloomy headlines. I would expect these worries to carry over into 2008. While the media and retail investors worry about what might happen to the economy and sectors that have been devastated by the subprime and housing mess, I’ll continue to focus on stocks and sectors that are currently rewarding investors behind the headline news. I believe this year will be just like last year. Money will be made following world growth trends. The sectors that worked last year will work again this year.
Oil and Gas exploration
Agriculture
Metals and Mining
Aerospace and Defense
Clean Energy (solar)
Foreign Cellular Companies
Dry Bulk Shipping
Stocks I currently own VIP, TRA, FCX, PBR, PBW, KALU, HOLX, ATW, DE and HAYN
Wednesday, January 2, 2008
2008

Wednesday, December 19, 2007
Recap 12/18/07
Yesterday’s trading started out on a positive note, after Goldman Sachs (GS) reported a record-setting fourth-quarter and the European Central Bank took drastic steps to help ease liquidity concerns. Europe's Fed offered up $501 billion to banks after presented unlimited 2-week funding at 4.21%, a move meant to fill in end-of-year funding gaps at major investment banks. Meanwhile, in the U.S., the Fed proposed a set of rules to help keep subprime-mortgage history from repeating itself.
After a midday dive to the downside, the Dow Jones Industrial Average (DJIA – 13,232.47) settled for a gain of 0.5%. The DOW’s intraday progress was halted by resistance from its 20-day moving average.
The S&P 500 Index (SPX – 1,454.97) turned in a gain of 9 points by the close, with the 1,460 level providing resistance to the index's rally. The Nasdaq Composite (COMP – 2,596.0) rose 0.8% higher but it could not get up to 2,600 level.
I am still net short but looking to lighten up. We had a good day psychologically as the market could have just rolled over. We need another up day tomorrow to get past the resistance. We also need the FED to cut inter-meeting. They are just sitting around waiting to see if their efforts will psychologically stabilize the credit situation. To this point it has not worked.
Maybe this is wishful thinking but the “Credit Crisis” has hit the front page of the New York Times, this is usually a good contrarian indicator of a top or bottom.
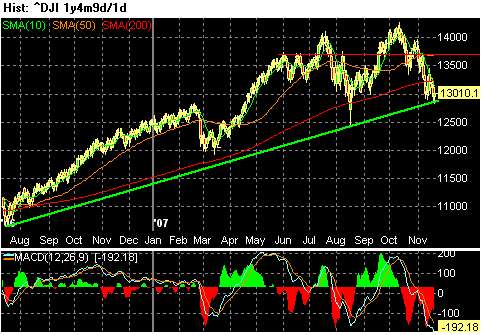
Dow Jones Industrial Average (DJIA – 13,232.47) - support at 12,500; resistance at 14,000
S&P 500 Index (SPX – 1,454.97) - support at 1,400; resistance at 1,510
Nasdaq Composite (COMP – 2,596.0) - support at 2,500; resistance at 2,800
Tuesday, December 18, 2007
Capital Preservation
Last Tuesday's Federal Open Market Committee meeting brought a rate cut, as everyone was expecting. Many - including myself - hoping for a more aggressive reduction of 50 basis points. We didn't get it, and the market was quickly punished. The next day, the Fed announced a plan where it and other central banks around the globe would pump money in to help with the credit-market fallout. After a sharp, and extremely brief early rally, stocks continued the rest of the week sharply downward. By Friday's close, the Dow Jones Industrial Average (DJIA) had given back 2.1% since the prior Friday, the S&P 500 Index (SPX) was off 2.4% for the week, and the Nasdaq Composite (COMP) had posted a weekly decline of 2.6%. Then over the weekend Greenspan reared his ugly head, talking about recession and possible stagflation. That killed the trade in Asia where all the bourses were down big. This translated to massive selling in Europe and then Americas.
Today, Goldman Sachs 4th-Quarter topped estimates but the beat did not buoy the shares, as they did not do their usual blowout. Still pretty impressive given the backdrop. BBY reported that third-quarter earnings rose 52% to $228 million, or 53 cents per share, compared to last year's $150 million, or 31 cents per share. Revenue for the quarter rose 17% to $9.93 billion. Analysts were looking for a profit of 41 cents per share. More importantly, Best Buy boosted its full-year earnings forecast to $3.20 per share from a prior guidance of $3.15 per share.
After the close last night, Adobe Systems reported that net fourth-quarter income rose to $222.2 million, or 38 cents per share, from $183.2 million, or 30 cents per share, last year. Meanwhile, revenue rose 34% to $911.2 million. Excluding certain items, earnings were 49 cents per share, edging past Wall Street's consensus estimate for 48 cents per share. Revenue was also above estimates for $887 million, according to Thomson Financial. Following the report, the shares dipped nearly 1% in electronic trading, but appear to have rebounded heading into the open this morning.
Shares of solar energy companies resumed their climb after dipping in Monday's session, as Lehman Brothers raised price targets on several names. Citing expectations that polysilicon, a key component of solar wafers, will continue to be in short supply, Lehman analyst Tim Luke raised his target on MEMC Electronic Materials to $110, from $90, implying he expects the stock to climb nearly 32 percent in the next year, from it's close at $83.42 Monday.
St. Peters, Mo.-based MEMC added $2.02, or 2.4 percent, to $85.44 premarket.
And shares of Epix Pharmaceuticals shot higher after the small biotech released study results for a drug to treat Alzheimer's Disease that it called "encouraging and compelling."
While the study was only two weeks long, investors didn't wait to bid up the Lexington, Mass., company's stock, pushing it higher by $1.70, or 57.2 percent, to $4.67 premarket, from its close at $2.97 Monday.
Economic Calendar
The economic calendar is all about real estate today, with the release of November's housing starts and building permits data. Wednesday's economic agenda is anemic, with the usual crude inventories the lone release. Thursday picks up, as the government will release the final Gross Domestic Product (GDP) report for the third quarter, as well as November's leading indicators, amongst others. Friday will end the week with November's personal income and spending reports, as well as the core Personal Consumption Expenditures (PCE) inflation data.
In August after a sharp rebound we went back down at around the level we are at know. This is a crucial psychological area. We need to keep going up from here to confirm this bull market. Real levels of support 12500 and 1400 on the DOW and S&P respectively.
Friday, December 14, 2007
Money Flowing Towards Oil Services
Big Oil is on a spending spree in the Gulf of Mexico.
A couple of months, the oil companies of the world spent more than $300 million on 18 million potentially oil rich acres in the Gulf of Mexico. The U.S. Mineral Management service packaged the acreage, located off the Texas coast, into 282 tracts.
The big winner was British Petroleum, which scooped up 91 tracts and spent $31 million. The big spender was Norway's Statoil, which paid more than $138 million for 36 tracts.
The opportunity of giant fields in the Gulf drew 47 companies to the auction. This list is interesting because it includes some quasi-state owned oil companies, such as Statoil and Brazil's Petrobras. In fact, these two companies are relative newcomers to the Gulf of Mexico.
Neither company is new to offshore drilling, though. Petrobras is one of the world's best deepwater drilling outfits... and currently operates 40 offshore drilling rigs, primarily off the coast of Brazil. The company has a single rig drilling in the Gulf of Mexico, Rowan's Bob Palmer. Statoil operates 24 offshore rigs, but none in the Gulf of Mexico.
There's a great reason the Gulf of Mexico is getting all this attention. It's one of the few remaining regions in the world with huge potential, and is owned by a government that doesn't claim the oil. Quite the opposite, the United States embraces competition for the oil. Also there is little risk aside from Hurricanes, people wont be trying to take workers hostage like in Nigeria, and there is less political risk as well.
So why not by the big oil companies? You have to understand that these are huge projects and they long time to complete. It will take years for you to see a return on their balance sheets.
However, if you invest in the service companies that immediately benefit from these deepwater spending sprees you'll continue to see terrific returns over the next six months to several years. As Big Oil continues to spend that money, the service companies are going to be the beneficiary for years to come.
Some ways to play this field are ETF’s and stocks. The ETF (XES) and (PXJ) are a basket of stocks in the oil services sector. Large caps with good fundamentals include Transocean (RIG), Shlumberger (SLB. A smaller comapny the the former two and in my thinking the best pick is National Oilwell (NOV) the stock is the most undervalued in the group and is growing EPS at >20%. MID cap, best play is CAM excellent management and growth. There are some riskier smaller companies like FTI, GRP and FTK if some wants a smaller cap plays.
Thursday, December 13, 2007
Profiting from Africa and The Middle East
The Middle Eastern markets are strong but it’s important to understand the Middle East is not just one market. It's 13 markets spread out over a huge space that takes many hours to fly over. And not all these places are driven by oil. Which is one of the misconceptions of the Middle East along with that its economy is highly dependent on oil and that if the price of oil drops the Middle East is doomed. For example oil only accounts for 3% of Dubai's GDP. It’s a fact that Dubai’s going to be completely oil dry in the next two decades.
Every market is different. In Morocco, the most important factor for economic growth is rain. In Egypt it's tourism. In Dubai, it's the nightlife.
And these economies are bigger than you might think. Taken as a whole, the Middle East is the eighth biggest economy in the world. On a per capita basis, Qatar, the United Arab Emirates, Kuwait, Oman, Bahrain, and others are richer than Russia, Brazil, and just about any other emerging market you can name.
There are incredible projects planned in the Middle East like the construction of the famous Palms and Globe (manmade islands shaped like a giant palm tree and a world map, respectively) and other surreal projects in Dubai. Dubai government to build a central utilities complex and cargo warehouse as part of Dubai International Airport expansion project.
The Middle East currently has more infrastructure projects planned than China and India combined. Saudi Arabia alone is planning 13 cities, not towns, but full cities the size of Dubai. And all of these projects are budgeted at $40 oil. Oil would need to fall more than 50% for these projects to be uneconomical."
You can't invest directly in most of these markets unless you're a citizen of the Gulf Cooperation Council. So most U.S. investors are out of luck. Also The Cooperation Council for the Arab States of the Gulf likes to keep its contracts and projects in-house as much as possible. In Saudi Arabia, 90% of businesses are privately held, family-run businesses. In Abu Dhabi, most of the city's largest developments are in the hands of a single development company, owned entirely by the government and answering directly to the crown prince. Contracts going to international firms are usually one-time (or, at most, two-time) deals. That’s why despite the calls of people like Jim Cramer, you can’t just buy Foster Wheeler or Halliburton to take advantage of this trend.
One way to invest is by using ETF, Symbol (GAF) State Street SPDR, but its mostly related to South African companies. The best way to invest by using the T Rowe Price Africa/ Middle East Fund (TRAMX).
Africa & Middle East Fund
Objective: The fund seeks long-term growth of capital by investing primarily in the common stocks of companies located or with primary operations in Africa and the Middle East.
Strategy: The fund expects to make substantially all of its investments (normally at least 80% of net assets) in African and the Middle Eastern companies. The fund may invest in common stocks in the countries listed below, as well as others as their markets develop:
Primary Emphasis: Bahrain, Egypt, Jordan, Kenya, Lebanon, Morocco, Nigeria, Oman, Qatar, South Africa, and United Arab Emirates.
Others: Algeria, Botswana, Ghana, Kuwait, Mauritius, Namibia, Tunisia, and Zimbabwe.
The fund is registered as "nondiversified," meaning it may invest a greater portion of assets in a single company and own more of the company`s voting securities than is permissible for a "diversified" fund. Depending on conditions, the fund`s portfolio should be composed of investments in about 30 to 40 different companies although the exact number could vary substantially depending on market conditions. The fund may make substantial investments (at times more than 25% of total assets) in the telephone or banking companies of various Middle Eastern and African countries. Stock selection reflects a growth style.
Estimated expenses:
Redemption fee 2.00% for shares held less than 90 days.
Management fee 1.06%
Other expenses 0.69%
Total annual fund operating expenses 1.75% (which makes it the highest expense ratio of any TRP International Fund).
Portfolio Management
Africa & Middle East Fund Christopher D. Alderson, Chairman, Ulle Adamson, S. Leigh Robertson, and Joseph Rohm. Mr. Alderson has been chairman of the committee since its inception. He joined T. Rowe Price International in 1988 and has been managing investments since 1986.
Crossroads

At the end of November I wrote about the BPFINA as a contrarian indicator and it responded with a 12% gain in the financials until recently. I was hoping the FED would cut aggressively but they did not. Right now the market has to solve this on its own. The indicator is in no mans land at the time being. I was hoping for a positive reaction to Lehman Brothers Holdings Inc. (LEH) whose executives said they are optimistic they won't have to write down another $830 million on floundering fixed-income assets in upcoming quarters, despite a slowing economy. The financials are down by an average of 2.5%, this is a bad sign.
Next week Goldman and Bear report, we need some good reports to get the financials going again.
Insider Buying

What a depressing day, or week for that matter, but according to a particular indicator things will get better.
The insider sales-to-purchases ratio was 13 in November. In other words, for every $13 corporate insiders took out of the market, $1 went back in.
I realize this doesn't sound terribly bullish, but remember that U.S. executives receive a ton of their pay via stock compensation. Stock options account for nearly half (48%) of CEO pay at Fortune 500 companies. So insider sales always outnumber insider purchases.
Because of this, anytime the sales-to-purchases ratio falls below 20, it's considered bullish... 13 to 1 is pretty bullish.
In dollar terms, insiders bought $297 million worth of stock in November. This isn't far off from the $330 million they bought in August before an 8% market rally. And in November, insiders only sold $3.8 billion worth of stock. That's the lowest November amount since 2002. But this is not a near-term indicator but forecasts 6 months down the road.
So in the middle of 08 the homebuilders, and financial stocks should be outperforming the other sectors. Along with this theme the basic materials should continue to boom to meet the new supply.
Look at the chart, its broken its downward trend if ever so briefly. But recently had a 20% move with a 50% retracement. Build a position for the next year, good entry point. Place stops slightly below the trendline.
EXAMPLES OF INSIDER BUYING
NVR
$52.4 million
Meritage Homes
MTH
$14.9 million
Brookfield Homes
BHS
$5.3 million
Pulte Homes
PHM
$150,000
KB Home
KBH
$93,000
$BPCOMP

Extremely Oversold
Bear-ly Hangin" In dustrials
Dow Graph: 11/20/07